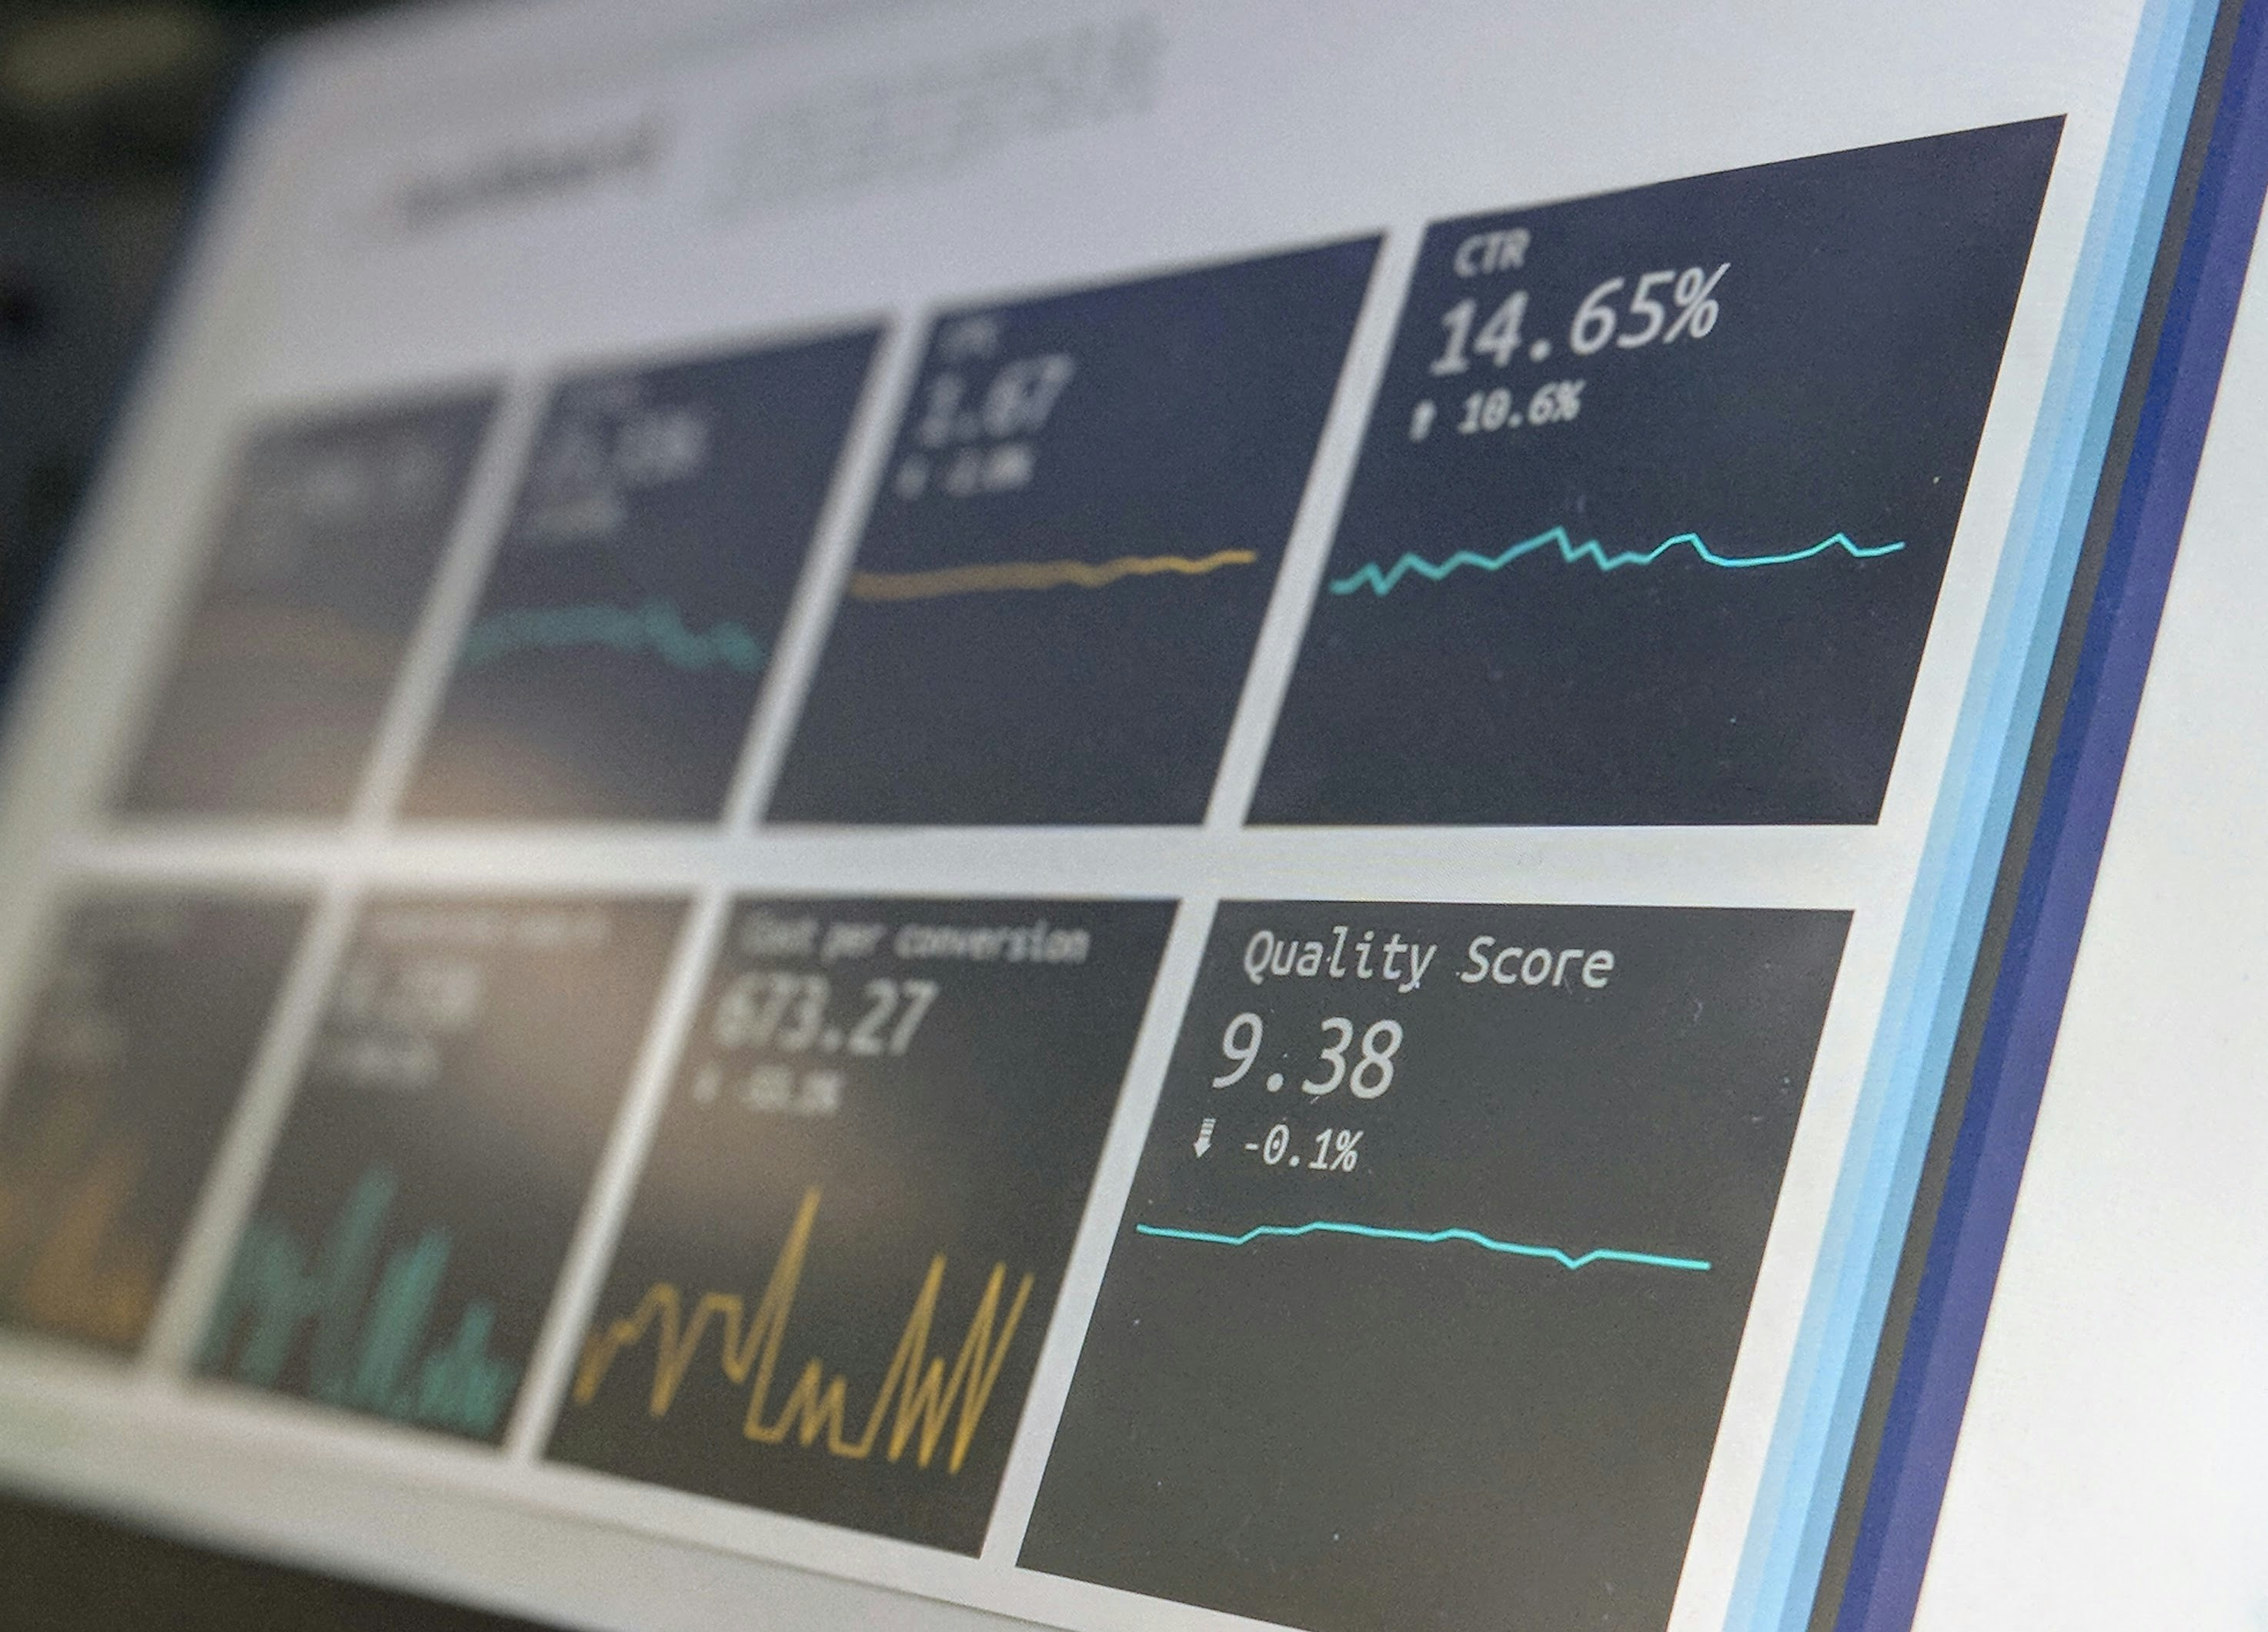
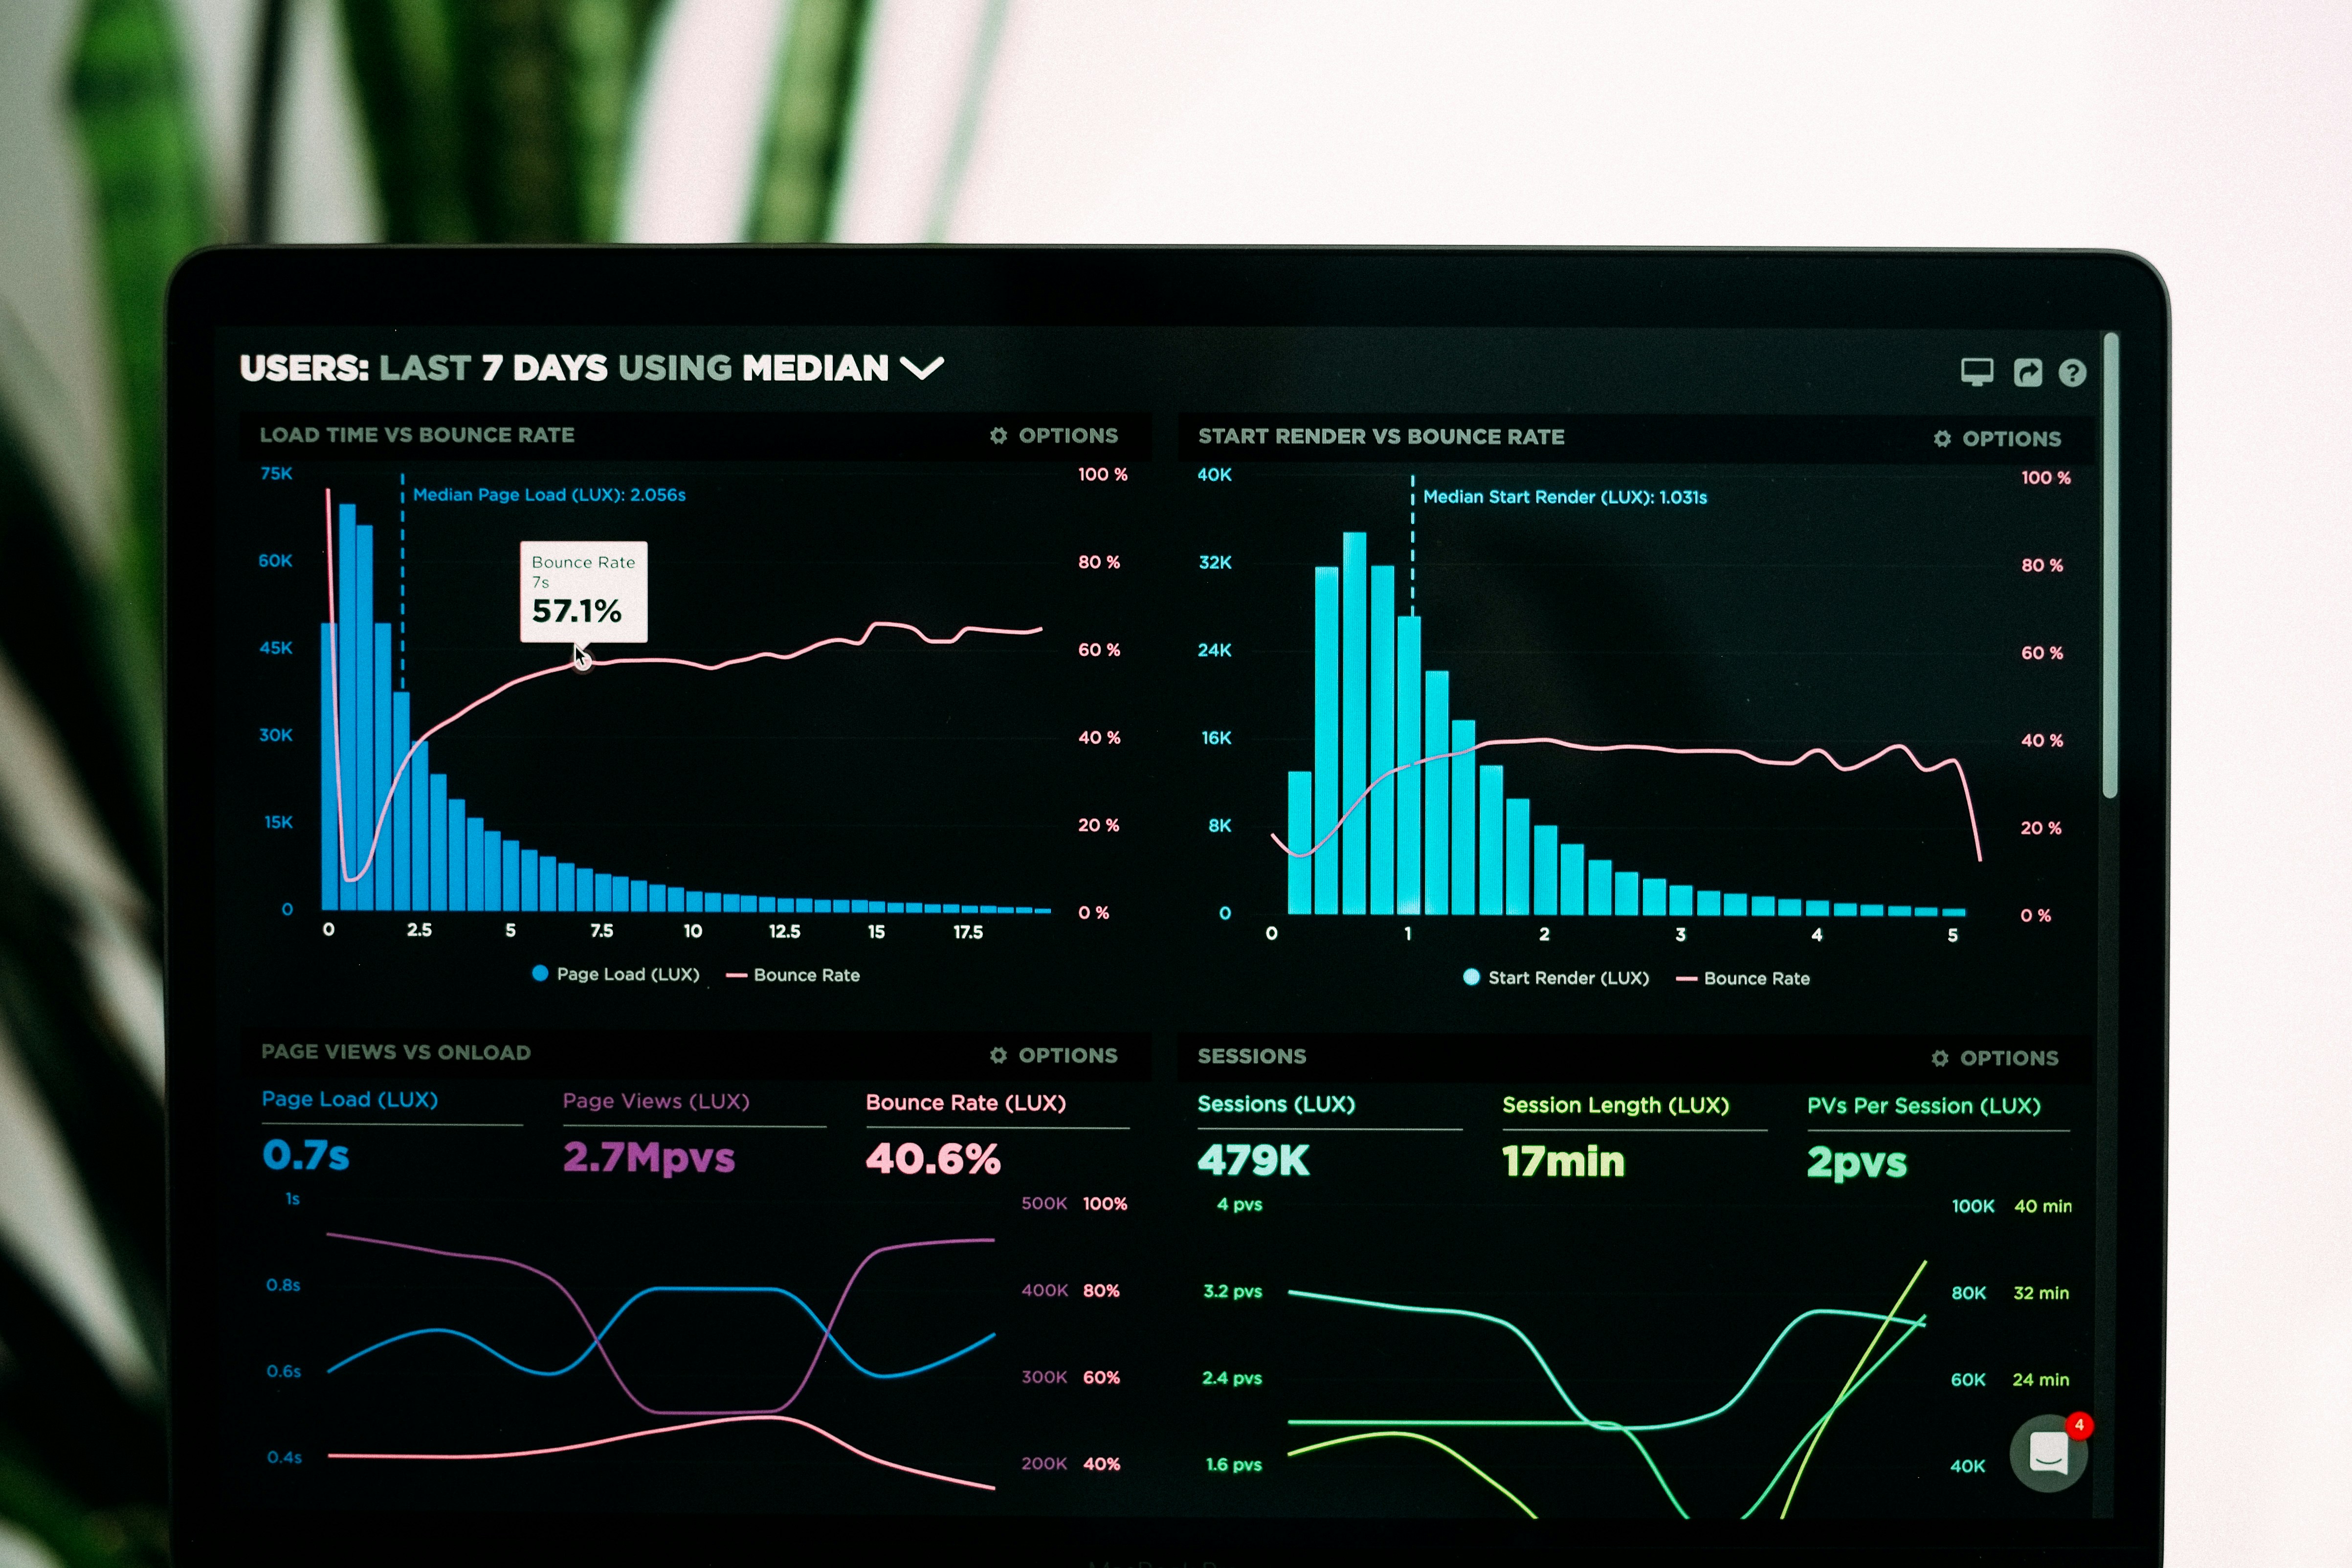
Visualize, analyze, and act on your data with intuitive and interactive dashboards tailored to your business needs.
What Are Data Analytics Dashboards?
Data analytics dashboards are centralized platforms that aggregate, visualize, and analyze critical business data. These dashboards enable businesses to track key metrics, identify trends, and make informed decisions in real time.
Dashboards provide businesses with a clear and actionable overview of their performance. Here’s why they’re essential:
How We Build Data Analytics Dashboards
1
Requirement Gathering
Understanding your business goals and the metrics that matter most.
2
Data Integration
Connecting your data sources, including CRMs, ERPs, and third-party tools.
3
Custom Visualization Design
Crafting charts, graphs, and KPIs for intuitive data interpretation.
4
Dashboard Development
Building interactive dashboards with filters and drill-down options.
5
Testing & Deployment
Ensuring data accuracy and user-friendliness before going live.
6
Continuous Optimization
Refining the dashboard for evolving business needs and performance.

Continuous Support
Ensuring your dashboards evolve with your business needs. With WEBMINIX, you turn data into a strategic asset for smarter decision-making.
Custom Solutions
Dashboards tailored to your business objectives and data sources.
Scalable Design
Built to handle growing data volumes as your business scales.
Intuitive Visuals
Clear, interactive visuals that simplify complex information
Seamless Integration
Compatible with all major business tools and platforms.


